TempHumForecaster
React · TypeScript · Flask · Python · Firebase · Raspberry Pi
Live
Problem
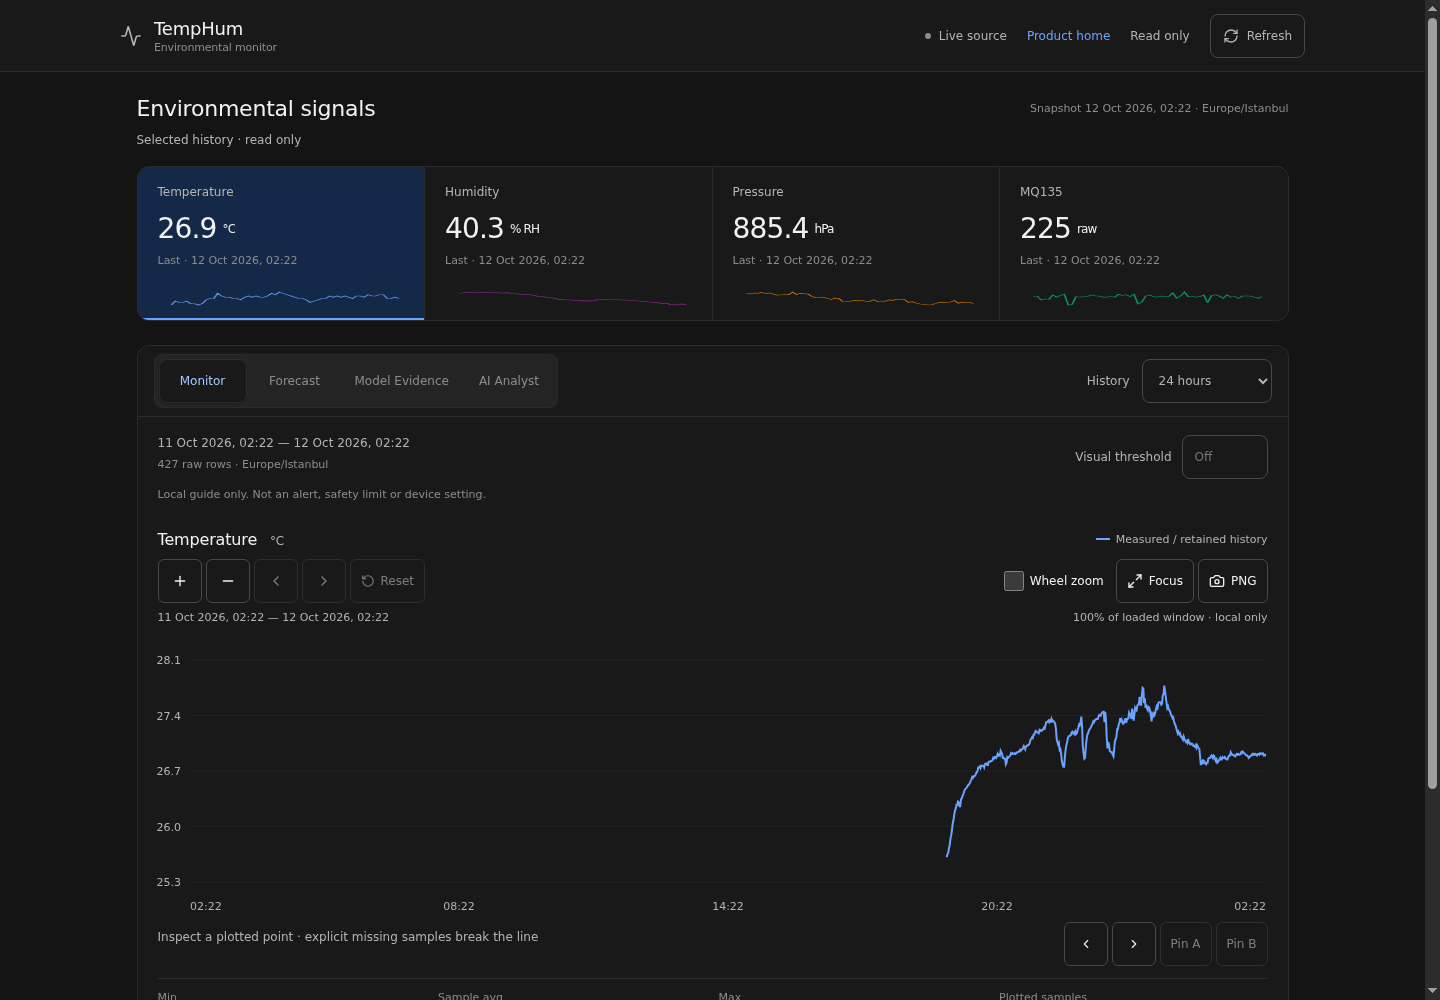
Environmental readings need a clear view of units, timestamps, historical trends and data availability without mixing monitoring with model or device writes.
Architecture
An independent product landing page and React/TypeScript dashboard backed by a bounded, read-only Flask API. Firebase provides configured sensor history. Python runs in an isolated Raspberry Pi container; Tailscale and Vercel provide HTTPS routing, not application hosting. An official Claude SDK integration is implemented but disabled by default.
Challenge
Keeping UTC history and local display consistent, preserving gaps and source freshness, making charts responsive and interactive, and securing a public interface without triggering inference or sensor writes.
Contribution
Built the product landing page, React monitoring workspace, bounded snapshot/detail/CSV APIs, historical Forecast and Model Evidence views, guarded Analyst integration, regression tests and isolated Pi deployment with rollback.
Constraints
Historical model evidence is research material, not live production accuracy. Claude AI Analyst backend, tools and interface are implemented but disabled by default pending genuine API validation. Raw MQ135 is not calibrated air quality, ppm, AQI or a safety assessment.
Result and evidence
A verified live deployment on temphumfor.tolgaugur.dev with a separate landing and monitoring dashboard, real-source history, interactive sensor charts and CSV exports. Release identity, static asset hashes, responsive browser flows, read-only boundaries and restart recovery were checked on the actual Pi-hosted service.
Open live project ↗